How To Create Simple & Effective Infographics - A Step By Step Guide
If you've never designed an infographic before, then this might post might give you the confidence to give it a go.
A while ago my wife was testing out a business idea around the concept of whole-food, plant-based cooking and using Instagram and our local network in Cologne to gain customers and subscribers. It was an experiment and it taught us both a few things about how to start a business such as this. Most notably, the whole idea was A LOT of work to get off the ground. Nevertheless, one of the skillsets I was able to develop was in creating infographics.
Over the years creating content, I have played around with a few different infographic tools including Piktochart, Venngage, Canva, and even Google Slides. Each has their pros and cons and each has its purpose.
For this exercise, I opted to use Canva. The main reason is I was looking for something that was:
- super intuitive and easy to use
- flexible enough to leverage the information I had to transfer (e.g. no complicated diagrams, graphs, etc.)
- free
Canva is my go-to design tool for a number of reasons, aside from those mentioned above:
- They have consistently improved their product over the years, releasing new features, fonts, templates, etc. that make designing easier and more fun
- I have an existing bank of images already saved to the image library that I can quickly reference in future designs
- It's super simple to upload any other images you want to your library with their drag and drop feature
Steps to designing an effective infographic
Step 1: Identify your content
The first step always starts with the content or information that will form the infographic. This is obvious, but most of the time your information will be in a longer form, such as a blog post or a report. So, the important exercise to do here is to try and structure the information in a way that:
- Only leaves the core messages/highlights
- Structures the information in a logical flow or hierarchy so that it's easy for the reader to follow
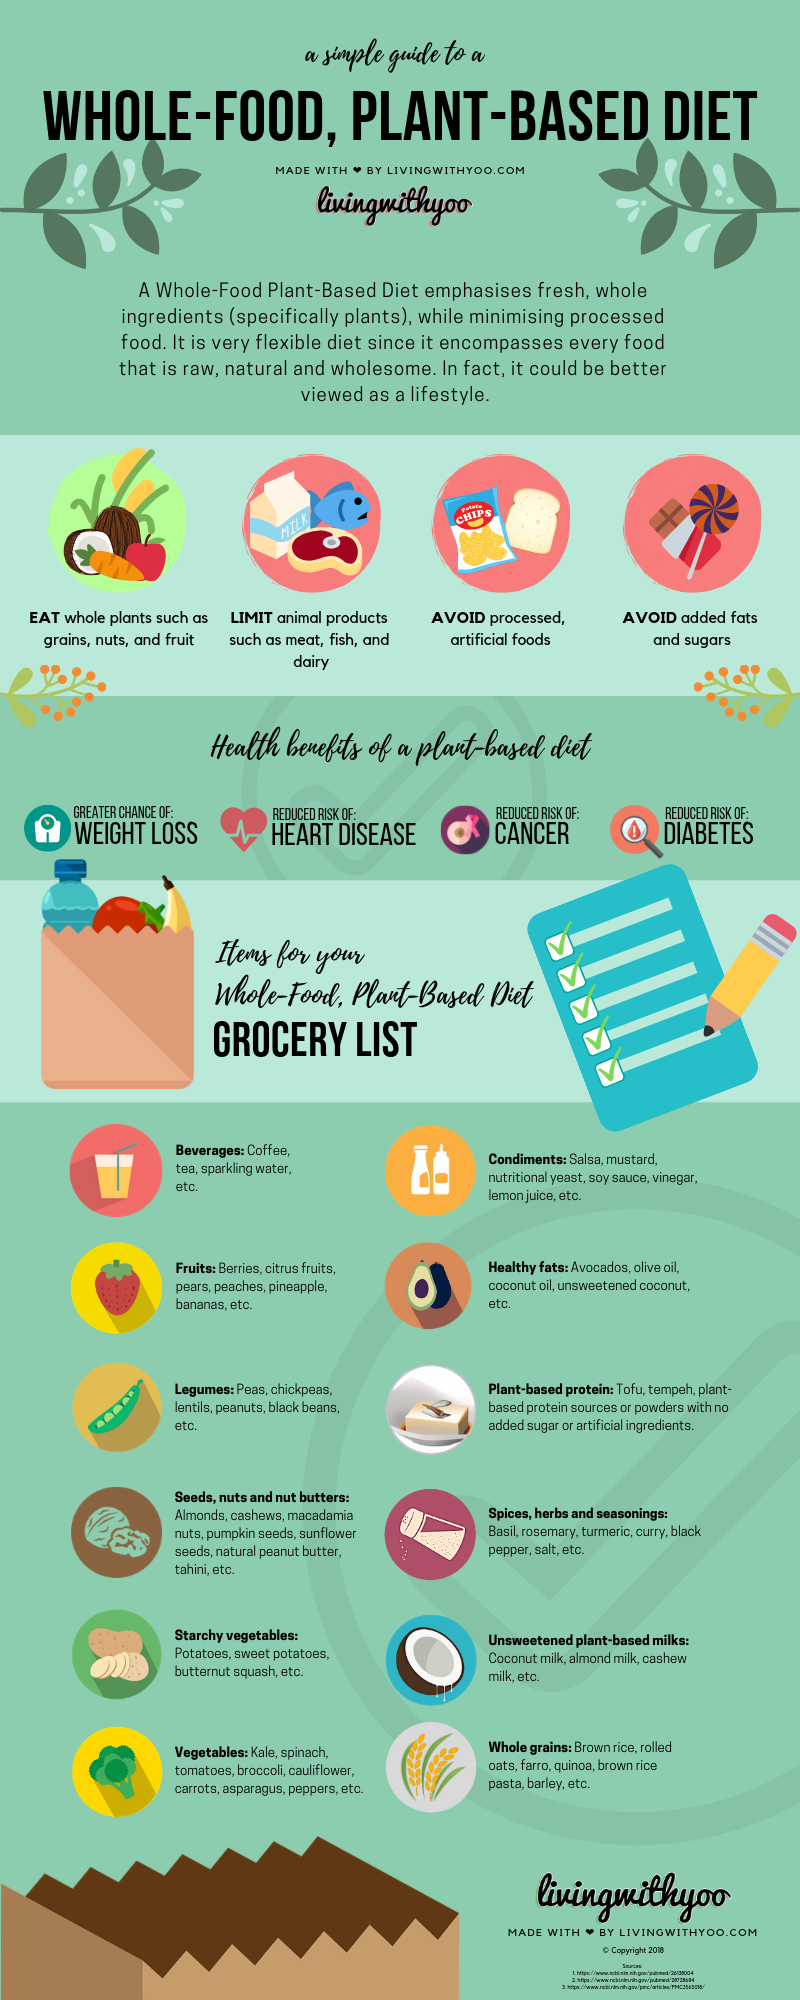
With the infographic below I started with a full-length document that goes into more detail about what a Whole-Food, Plant-Based Diet actually is. The basis of this document lived in a Google Doc.
When it came to structuring what content should be included I simply skimmed through the Google Doc and highlighted the headings or topics I wanted to include. Typically, and in this case, I highlighted the introduction, a few of the headings, and looked for sections in the document that were bullet-pointed. As I skimmed through, I also kept thinking in the back of my mind what images might relate to the information I'd just highlighted. For example, since the information was talking about the health benefits of this diet, I was thinking about what imagery would convey keywords like "Weight-loss" (e.g. weighing scales) and "Heart disease" (e.g. beating heart icon).
Step 2: Plan your design
Once I had highlighted the key information I wanted to include in the infographic, I got a piece of paper and wire-framed out the layout. This method isn't always necessary, but it does help to keep your efforts focused rather than getting carried away inside the tool of choice. You don't need to use a piece of paper for this step either. You may decide to actually use Canva for this purpose, which is completely fine. When I take this route, I create two pages/slides in Canva: 1) is the wireframe, and 2) is the actual infographic canvas.
Part of this step includes considering what colour theme you want to go with. For example, my infographic is about a whole-food, plant-based diet, so using a colour scheme of green with some complimentary colours from the livingwithyoo.com website made things gel well.
Step 3: Source images
Now that you have your basic structure and layout prepared, it's time to start image hunting. For infographics, in particular, it's likely you'll want to leverage icons, and the best way to find free icons to use is through Google Images and FreePik. Canva also has an icon and image finder built-in, so you can also use this as an image source. However, many of the good icons will require you to pay for them in your final design, so keep that in mind.
The images you'll want to download should be transparent PNG files. This is important because otherwise when you import them on your infographic, you'll get everything around it as well (see the image example below).

Tips
1. Your image search should look like this - <image name e.g. banana> icon transparent png
2. If you're using several icons on your design, it's important to try to find similar-looking icons so that your infographic has some design consistency.
3. When you're relying on free images from Google it can take a little while to find suitable and un-watermarked png files, so you might need to scroll through a page or two to find what you need. Just because you've used the search query that includes "transparent png" doesn't mean all search results will show what you want.
4. Before you right-click-save-image-as on the image you want, first click and drag the image away a little. This is a fast way to identify whether the image is transparent or not. Below is an example that illustrates this. On the left you can see there are no white edges to the banana icon, whereas on the right, you can see there is a full white background on the image.
![]()
Transparent Image
![]()
Non-transparent Image
Step 4: Upload your icons and images
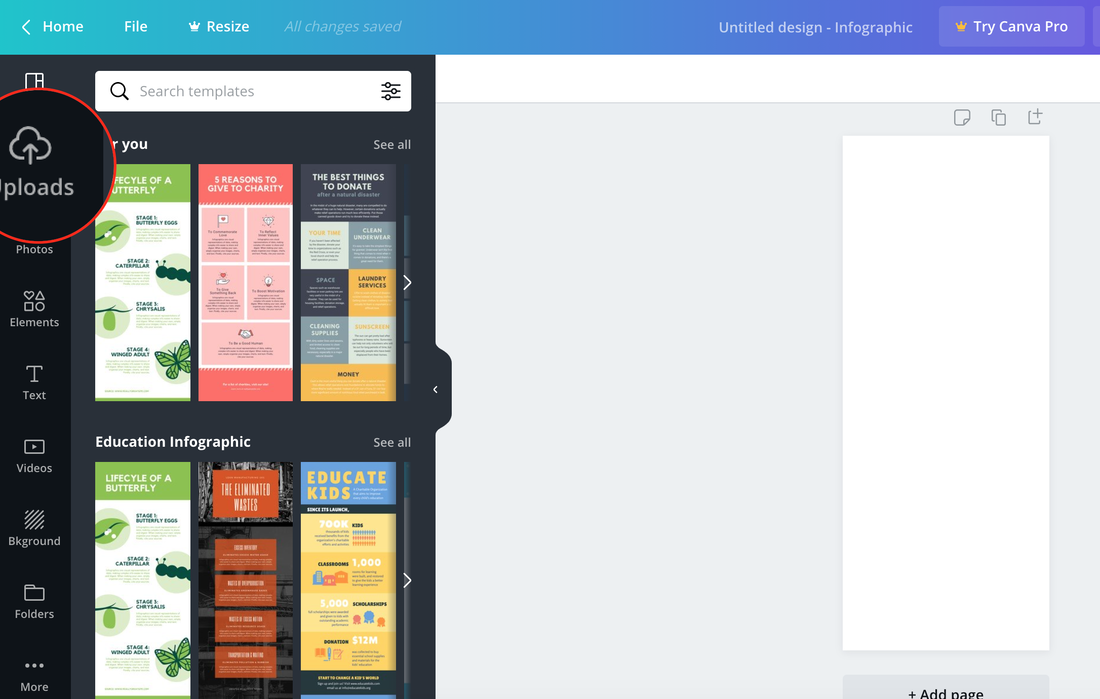
Once you've downloaded a bunch of icons to your computer, it's time to upload them to Canva. To do this is simple. Open your infographic layout, click the Uploads icon in the menu then drag and drop your images to the canvas. Depending on how many images you want to upload, this process could take a little while to complete.
See the images below for reference.
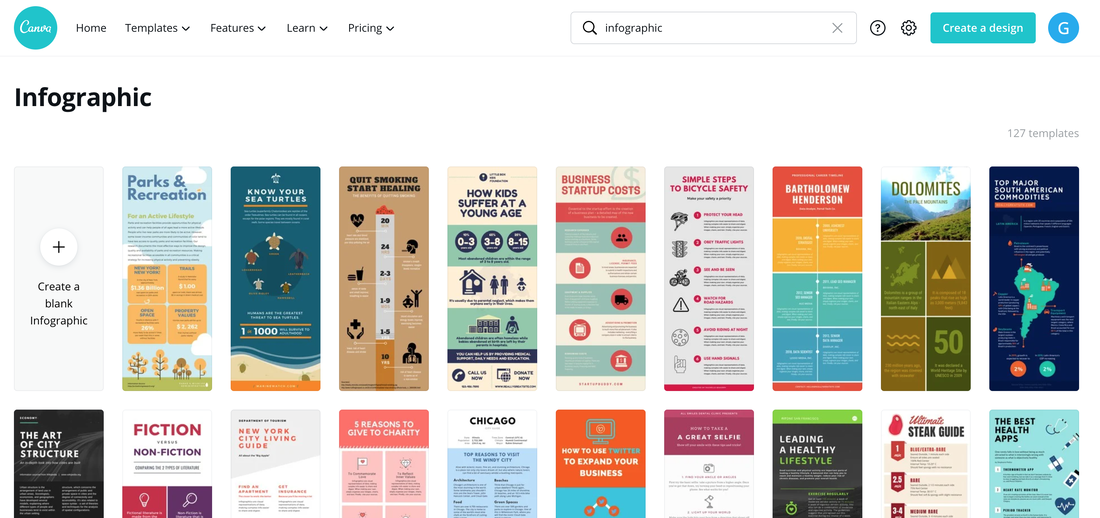
Choose a pre-designed infographic template or create your own design from a blank infographic.
Step 5: Create your infographic
Now you have all your icons and images uploaded to Canva you can start dropping them onto your infographic and manipulating the elements to build the wire-frame structure from Step 2.
After a little while of adjusting font sizes, types, icons, images, etc. you should have formed a decent infographic you can now use on your website for engaging content, lead generation, and more.
The final product: